Statistics play an important role in determining the growth rate of the rental business industry.Other than the growth rate, you can analyze the past data of customer interest, market demand, and profit to predict the future.
The rental business statistics help business owners to make the right business decisions during uncertain times.
In this blog, read new statistics about the rental business industry that you should know.
If you are a budding entrepreneur trying to start a rental business, I am sure these statistics can help you figure out the profitability of the rental industry.
Rental business statistics
The total value of the global sharing economy is predicted to increase to 335 Billion U.S. dollars by 2025, compared to 15 billion U.S. dollars in 2014.
According to Statista, the value of the sharing economy market is increasing steadily from 2014 to 2025. It is safe to say that the increase in the value of the sharing economy business is due to the benefits it offers to customers such as convenience and affordability.
About 44% of Americans are familiar with the sharing economy business model.
According to the 2015 survey done by PwC with 1000 U.S customers, almost half of Americans are aware of the sharing economy business model. Then, 18% of U.S. adults have been a customer and 7% are providers.
Out of 44% who were aware of the sharing economy business, 23% are currently providers and 51% said they could see becoming providers in the next two years.
In 2016, about 44.8 million adults were using the popular sharing economy services in the United States. By 2021, the figure was forecasted to increase to 86.5 million. (Source: Statista)
From this rental business statistic, we can conclude that the sharing economy platforms have impacted the people profoundly. We can immediately book a car, home, equipment, boat, parking space, etc for rent. People won’t stop using these services as it has made their lives easier.
According to McKinsey, in the U.S. and Europe alone, 20-30 percent of the workforce are providers on sharing platforms.
78% of consumers agreed that the sharing economy reduces clutter and waste. Also, people see rental platforms as an opportunity to earn extra money from lending their property.
Top rental business ideas
We made a list of popular rental business ideas that are practically implementable.
- Vacation rental – Rent vacation homes like mansion, bungalow, cotton home.
- Car rental – Rent high-end cars like Tesla to low-priced cars like Ford.
- Boat rental – Rent a boat for recreational activities, fishing, or party celebrations.
- Bike rental – Travel locally with low-cost bikes.
- Bus rental – Rent bus for parties, traveling with friends or family, school tour, etc.
- Scooter rental – Travel and sightsee different places in town by renting a scooter.
- Equipment rental – Rent equipment for gardening, camping, fishing, etc.
- Apparel rental – Rent a party-wear dress for a day to attend a wedding, prom, special occasion, etc.
- Sports equipment rental – Rent equipment for playing any sport.
- Music instrument rental – Rent any musical instrument for performing in a band, stage, musical group, etc.
Statistics on vacation rental business
In 2019, the value of global vacation rental market size is at USD 87.09 billion. It is expected to expand at a compound annual growth rate (CAGR) of 3.4% from 2020 to 2027.
According to the report by Grand View Research website, the market size of the global vacation rental market is expected to increase at a compound annual growth rate of 3.4%.
Millennials are the main reason for the increasing growth of the market size.
Revenue is expected to show an annual growth rate (CAGR 2020-2025) of 15.8%, resulting in a projected market volume of US$101,861m by 2025.
After the advent of Airbnb, customers began to prefer vacation rentals platforms that are convenient to book, offer low prices compared to hotels, and be a kids and pets friendly place.
Customer interest in tourism has led to an increase in the revenue of vacation rentals.
According to the analysis of Hostfully, there are 115,000 vacation rental companies worldwide.
With the increase in the revenue of the vacation rental industry, entrepreneurs incline towards starting a vacation rental business in their local community.
As per the report published by Airbnb, millennials and younger generations will account for 75% of all consumers and travelers by 2025.
According to the SOTI survey, the big reasons why Millennials travel so much are the adventure, food, and ‘bleisure’ – business + leisure travel. Also, around 86 percent of millennials chose to experience a new culture over partying (44 percent) and shopping (28 percent).
The internet and tourism blogs have exploded the dreams of Millennials and made them independent to travel anywhere by preparing themselves for accommodations and food.
Famous vacation rental platforms
The famous vacation rental platforms are,
- Airbnb
- Tripping.com
- VRBO
- HomeToGo
- Booking.com, etc.
Statistics on car rental business
The value of global car rental market size is at $92.92 billion in 2019. It is projected to reach $214.04 billion by 2027.
The market size of global car rental has projected an annual growth rate of 10.7% from 2020 to 2027.
Technology has made renting a car through mobile apps easier. Also, the popularity of car-sharing apps like Turo, Zipcar, has inspired budding entrepreneurs to start their own car rental business.
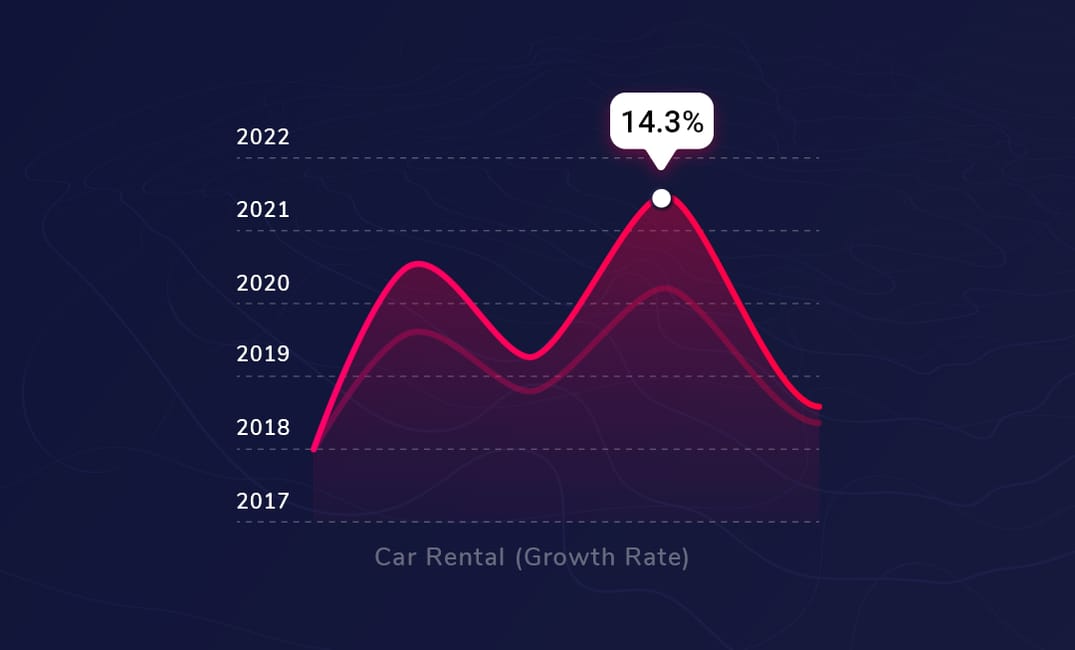
The Revenue of the global car rental is expected to show an annual growth rate of 14.3% between 2020 to 2025.
According to Statista, the global market volume of car rental by 2025 is US$110,894M. The steady growth of the car rental industry is due to the expected worldwide growth in the travel and tourism sector. The growing number of leisure trips to other countries has boosted the revenue of car rental companies.
In terms of revenue, North America accounted for the highest share in the global car rental market in 2019.
The rise in demand for car rental services among millennials is due to its low-cost compared to owning a car.
Famous car rental platforms
The popular car rental platforms are,
- Lyft
- Turo
- Hertz
- Sixt rent a car
- Avis car rental, etc.
Statistics on boat rental business
The boat rental market is anticipated to have an annual growth rate of 5% during the forecast period (2020-2025).
Mordor Intelligence released the report analyzing the growth of the boat rental industry within the period 2020-2025.
From this rental business statistic, we can infer the consistent growth of the industry is due to the booming marine tourism industry and the increased interest of people in recreational activities.
In 2019, the Recreational Boating Market size exceeded USD 43 billion.
According to the report, the outboard recreational boating market in the U.S. accounted for around 60% revenue share in 2019 due to technological advancements, lightweight, fuel economy, and more interior space.
It is also because people want to have fun by engaging in water recreational activities like scuba diving, snorkeling, kayaking, jet-skiing, parasailing.
Famous boat rental platforms
The welcomed boat rental companies are,
- Boatsetter
- Click&Boat
- Antlos
- GetMyBoat
- Sailo
- Zizoo, etc.
Wrapping up
Now, are you ready to start your rental business?
These rental business statistics not only are insightful but also unveil to us the past success and the current market demand.
I hope these stats enable entrepreneurs like you to make wise decisions in starting a rental business in the coming years.